
We put the Apple iPhone 14 Pro Max through our rigorous DXOMARK Display test suite to measure its performance across six criteria. In this test results, we will break down how it fared in a variety of tests and several common use cases.
Overview
Key display specifications:
- 6.7-inch OLED, ~88.2% screen-to-body ratio
- Dimensions: 160.7 x 77.6 x 7.85 mm (6.33 x 3.06 x 0.31 inches)
- Resolution: 1290 x 2796 pixels, (~ 460 ppi density)
- Aspect ratio: 19.5:9
- Refresh rate: 120 Hz
Scoring
Sub-scores and attributes included in the calculations of the global score.
 Apple iPhone 14 Pro Max

Pros
- Boosted outdoor performance, thanks to impressive brightness (measured at over 2000 nits) that improves readability and color rendering
- HDR shows fine contrast tuning, close to the artistic intent, and indoor brightness (1090 nits) is suitable for enjoying HDR content
- Almost no frame drops are visible when playing videos or when gaming
Cons
- Viewed on angle, the color cast shifts to green, which impacts skin tone rendering
- Touch interaction lacks smoothness when gaming
- Some imprecise lighting transitions while watching video content
With the appearance of the iPhone 14 Pro Max, Apple continues to refine its flagship product, with the new device surpassing the performance of the iPhone 13 Pro Max in nearly every attribute.
The new model’s display is the brightest among all devices tested to date — over 2000 nits (measured), which means content is readable even under bright sunlight; moreover, the increased brightness also improves overall color rendering.
Although there was no significant improvement in handling SDR video content, whose brightness remains sometimes too low, the new iPhone shows advances in fine contrast rendering of HDR10 content, and has much better playback management than the 13 Pro Max.
As with Apple phones generally, the 14 Pro Max continues to show superior control of aliasing. But when gaming, or watching movies, users might find the new notch design uncomfortably intrusive.
Test summary
About DXOMARK Display tests: For scoring and analysis in our smartphone and other display reviews, DXOMARK engineers perform a variety of objective and perceptual tests under controlled lab and real-life conditions. Note that we evaluate display attributes using only the device’s built-in display hardware and its still image (gallery) and video apps at their default settings. (For in-depth information about how we evaluate smartphone and other displays, check out our articles, “How DXOMARK tests display quality” and “A closer look at DXOMARK Display testing.”
The following section gathers key elements of our exhaustive tests and analyses performed in DXOMARK laboratories. Detailed performance evaluations under the form of reports are available upon request. Do not hesitate to contact us.
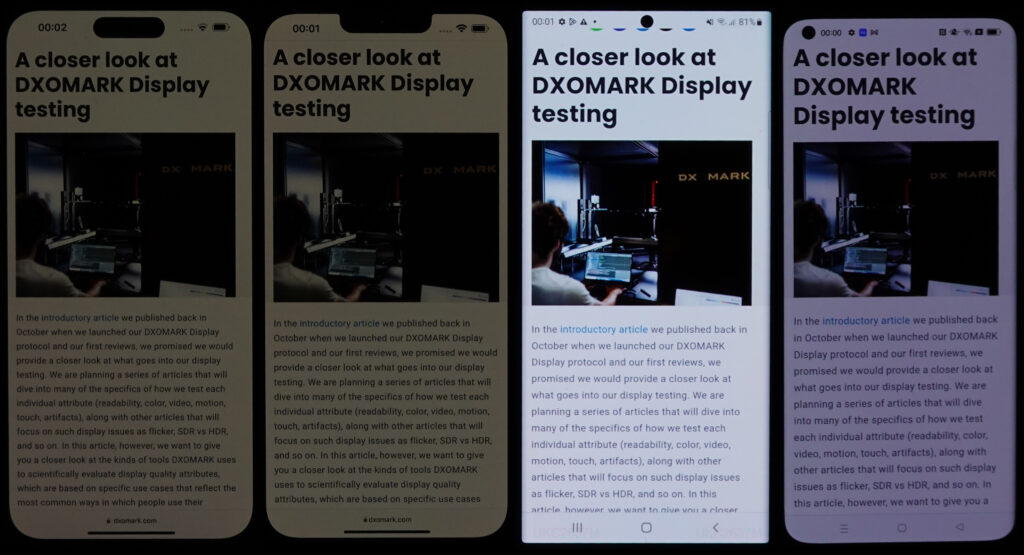
Readability evaluates how easily and comfortably users can read still content (photos & web) on the display under different real-life conditions. DXOMARK uses its Display Bench to recreate ambient light conditions ranging from total darkness to bright sunlight. In addition to laboratory tests, perceptual analysis is also made in real-life environments.
The Apple iPhone 14 Pro Max is the brightest device tested to date, although the increased brightness is not available for all content. That said, the new device has a noticeable advantage over other phones in terms of outdoor readability. At its default settings, it is still not bright enough in low-light environments, but it has good smoothness when adjusting to different ambient lighting conditions, and shows better overall uniformity than its immediate predecessor.
Although the iPhone has higher brightness than the Samsung, its contrast value is lower due to a less profound dark (28 nits for the iPhone versus 19 nits for the Samsung).


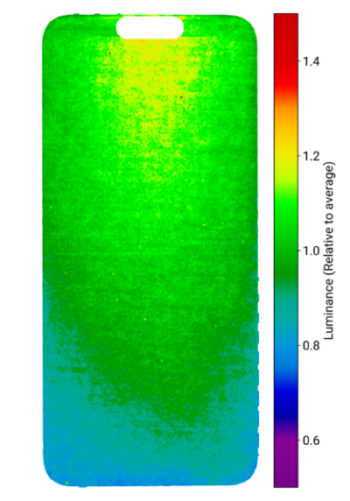
The notch of the iPhone 13 Pro Max generated some uniformity issues in the top part of the display. Now that Apple has switched to a punch hole notch on the 14 Pro Max, the uniformity considerably improved, as shown below.
Color
Apple iPhone 14 Pro Max
163
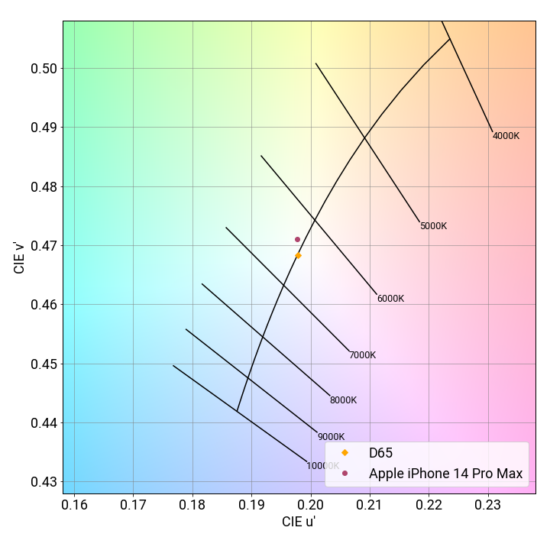
The color attribute evaluates the capacity of the device to accurately reproduce colors. The measurements taken are for fidelity, white point color, and gamut coverage. We perform color evaluations for different lighting conditions to see how well the device can manage color in the surrounding environment. Colors are measured using a spectrophotometer in a controlled lighting environment. Perceptual analysis of color rendering is against the reference pattern displayed on a calibrated professional monitor.
The iPhone 14 Pro Max shows much better color uniformity than the 13 Pro Max. In low light, content on the 14 Pro Max takes on an orange cast; indoors, the new device’s color cast is a bit more neutral than its predecessor’s. And while skin tones are still a bit yellow when viewed outdoors, the 14 Pro Max’s rendering is better than the 13 Pro Max’s yellow-green skin tones under the same lighting conditions. On angle, however, the 14 Pro Max takes on a greenish cast that adversely impacts skin tone rendering.
The brightness boost allows the iPhone 14 Pro Max to present more lively colors with the right amounts of detail and shade, whereas the iPhone 13 Pro Max is a bit washed out and the Samsung Galaxy S22 Ultra (Exynos) loses all nuances.
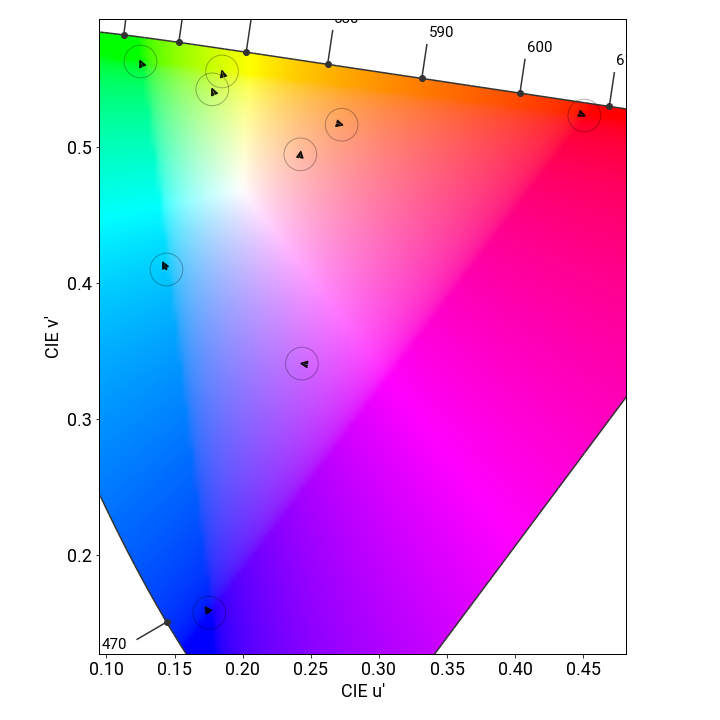
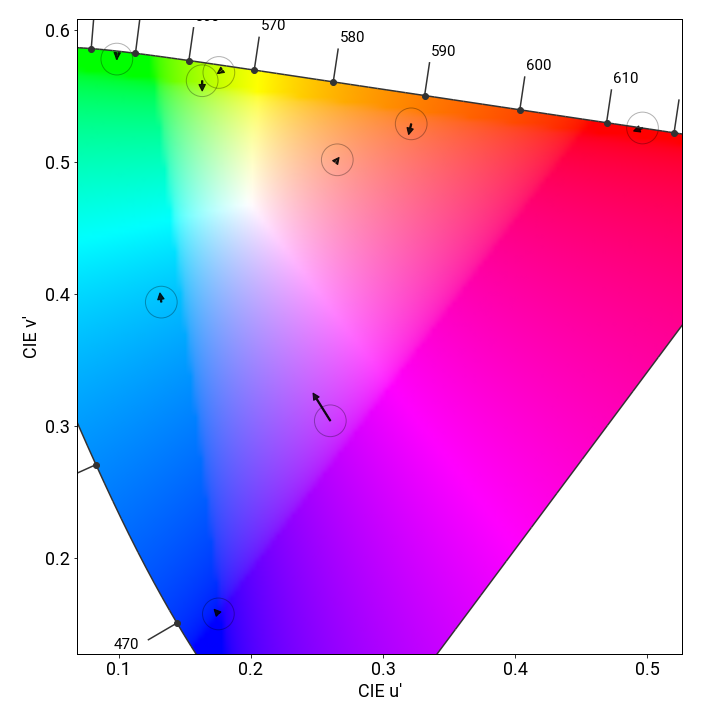
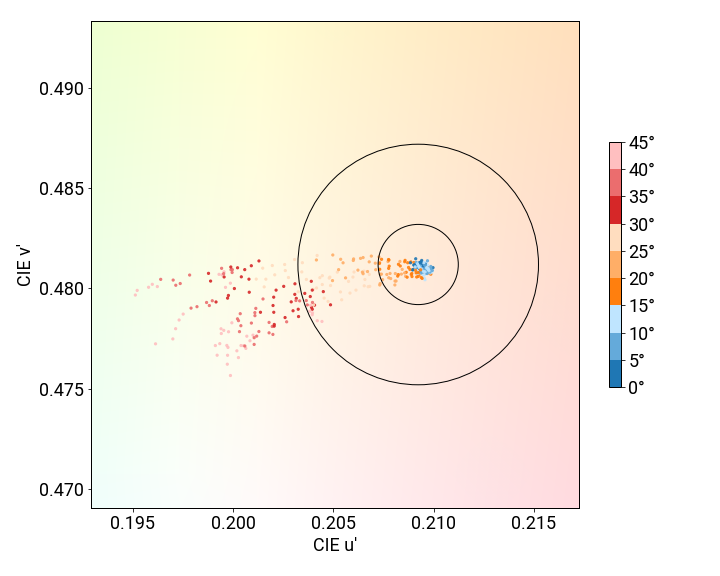
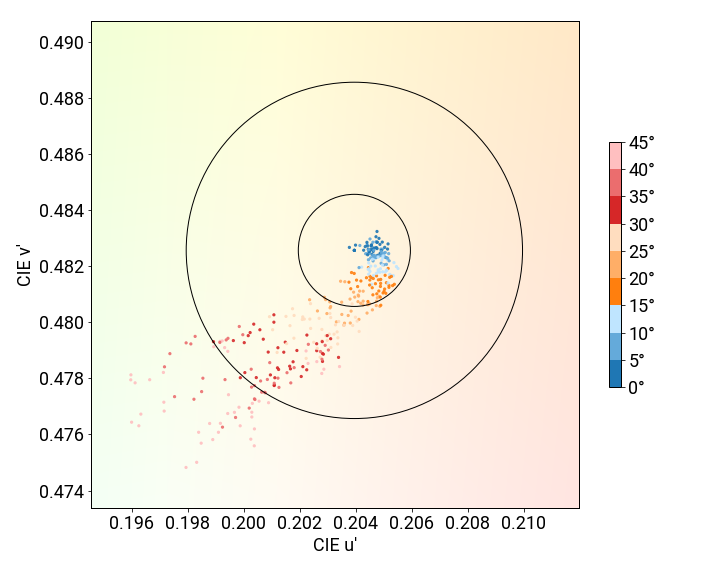
Regarding color shift in angle, the iPhone 14 Pro Max is less performant than its predecessor. Not only is the shift more pronounced, as the iPhone 14 Pro Max is more orange to begin with, but colors also shift more rapidly. For example, at a 30° angle, the iPhone 14 Pro Max shifts towards green over 3 JNCD in some cases, while the shift for iPhone 13 Pro Max is around 2 JNCD, as you can see in the graphs below.


Video
Apple iPhone 14 Pro Max
162
Our video attribute evaluates the Standard Dynamic Range (SDR) and High Dynamic Range (HDR10) video handling of each device in indoor and low-light conditions. We measure tone mapping, color gamut, brightness and contrast of the display. We perform perceptual analysis against our professional reference monitor (Sony BVM-HX310) to ensure that the rendering respects the artistic intent.
The Apple iPhone 14 Pro Max puts in a solid performance when handling HDR content, but its SDR video performance remains similar to that of the 13 Pro Max — that is, users may need to manually adjust the brightness to enjoy SDR content in a dark environment. But the 14 Pro Max’s improved contrast produces a rendering with more visible dark tones are more visible and natural highlights.
Although acceptable, the new iPhone’s color cast is less neutral (in other words, more yellow) that of the 13 Pro Max.
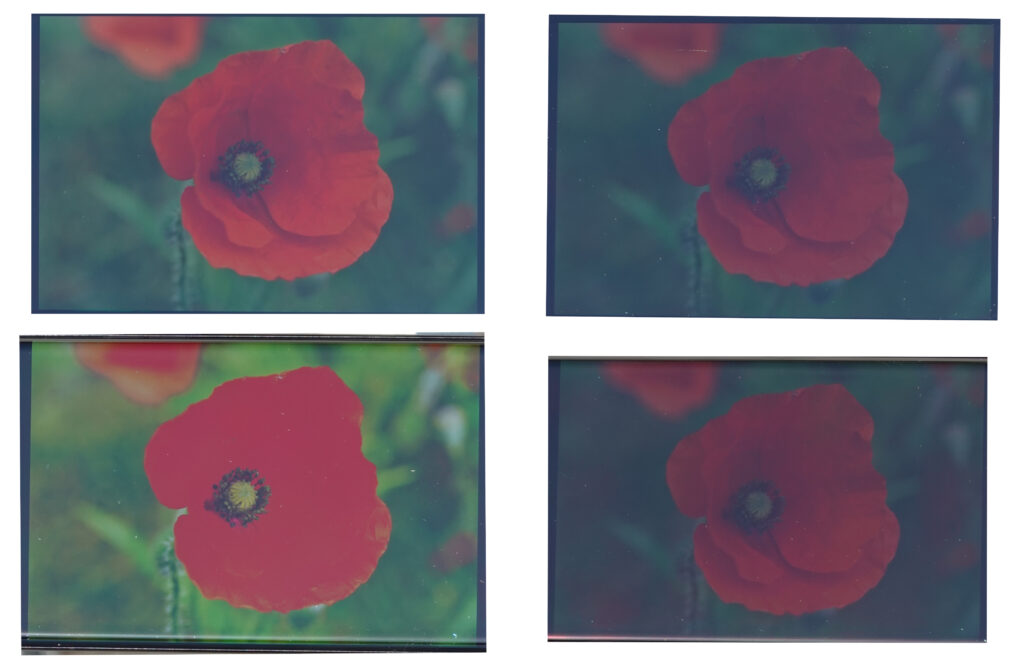
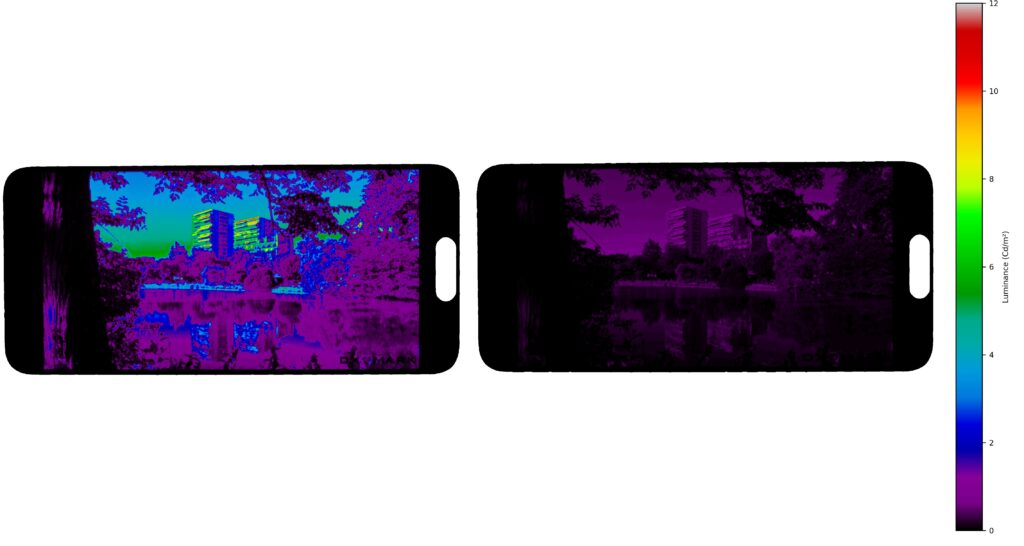
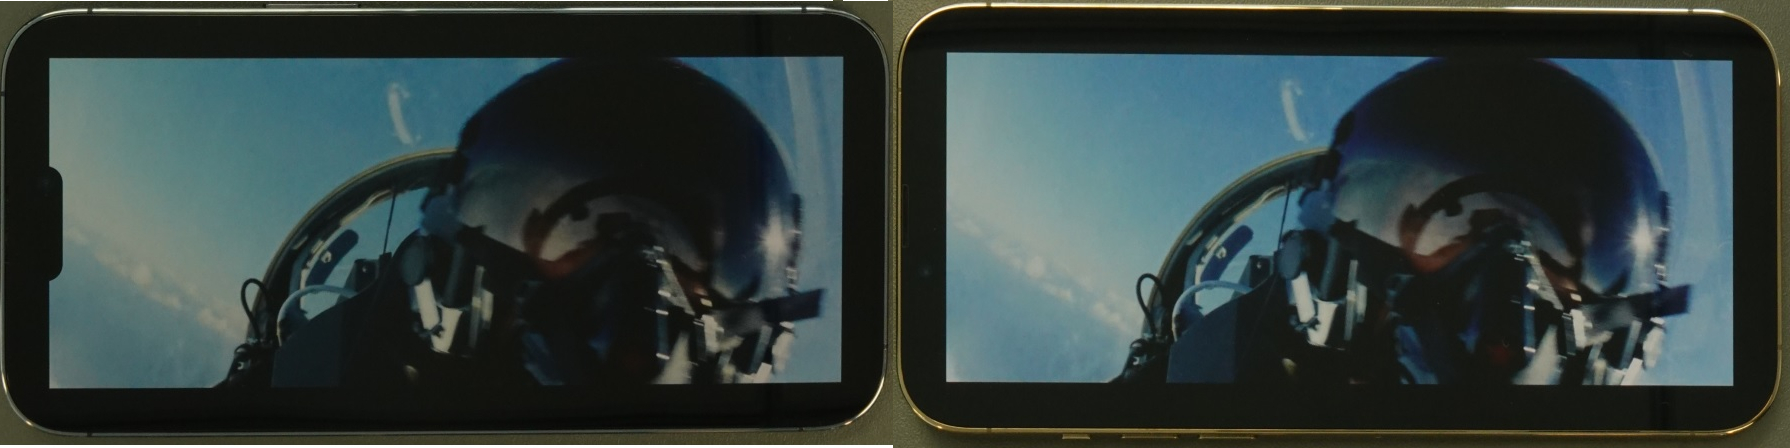
The illustration below represents the brightness measurement (in false colors) of the same video played on the iPhone 14 Pro Max. The example on the left is HDR10, and the one on the right is SDR. The SDR-encoded video is too dark for the eyes, even on mid-tones, compared with the same video that is HDR-encoded. As a result, the user will have to manually adapt the screen brightness when switching between SDR video and HDR video content.
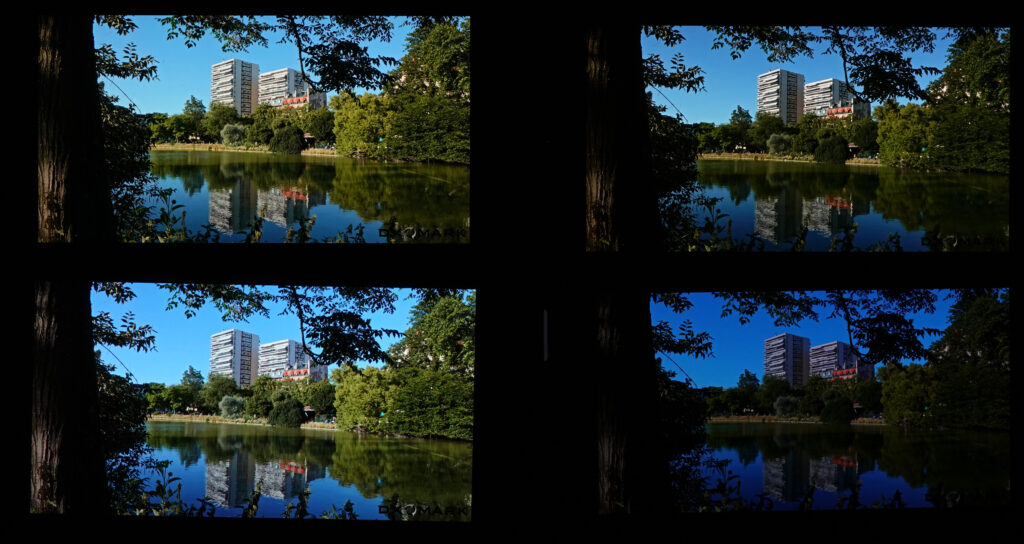
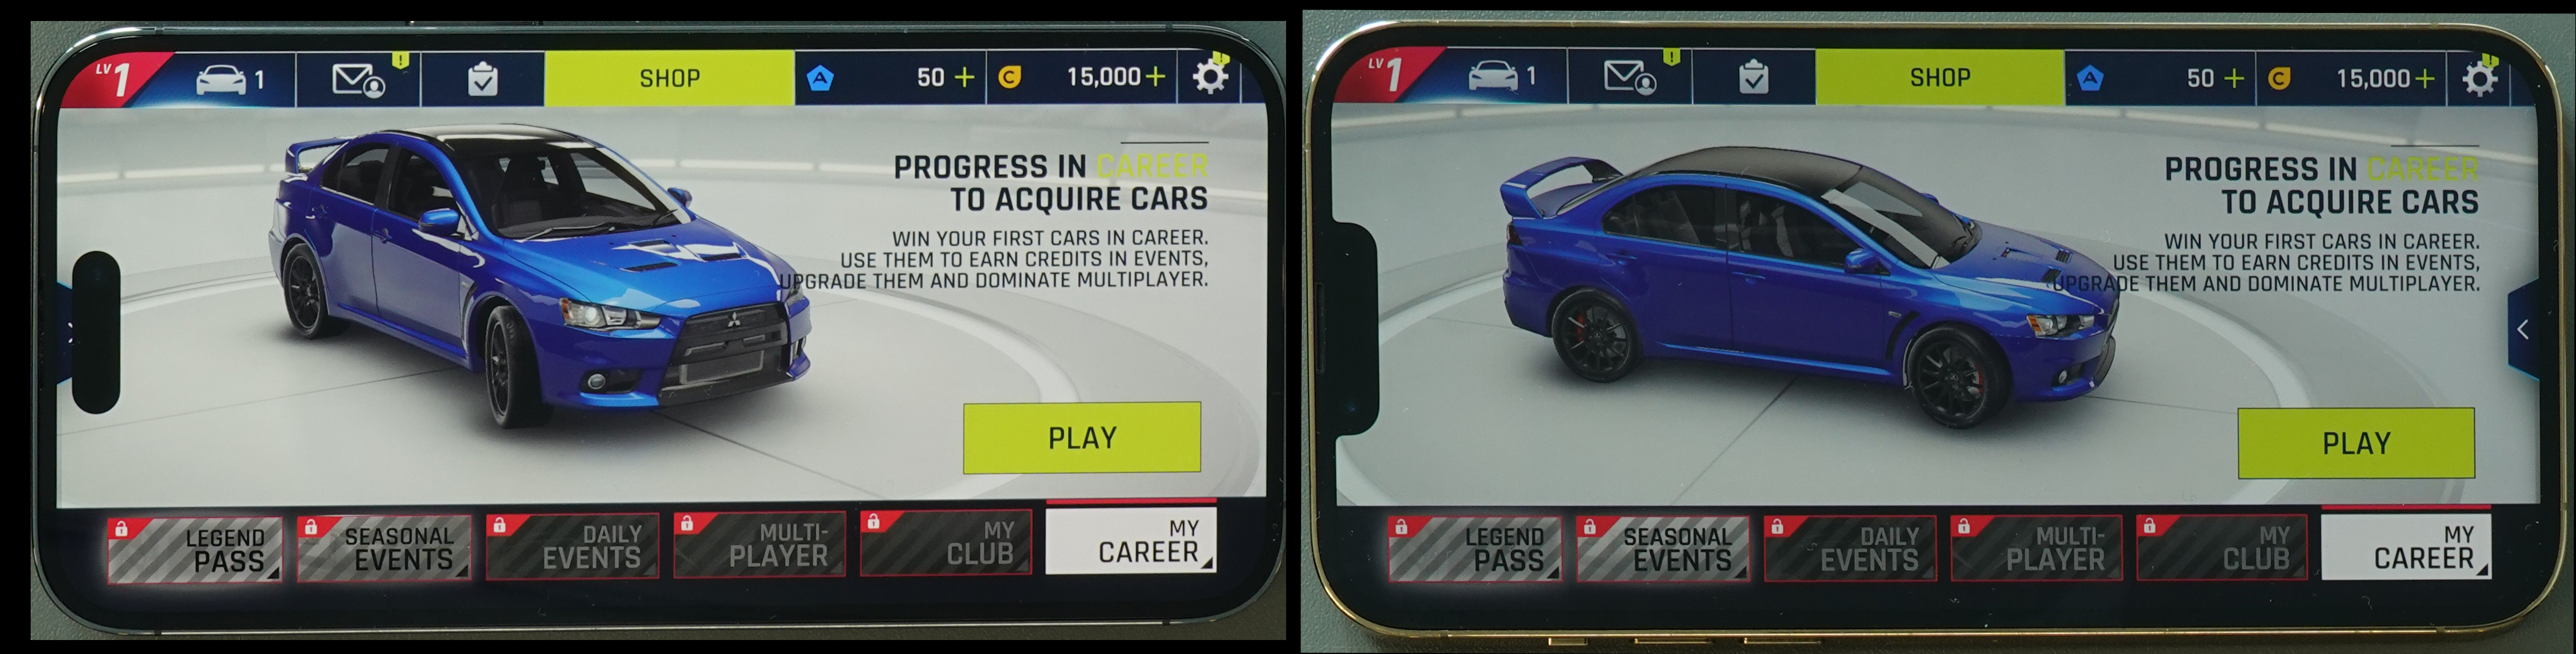
Clipping artifacts are visible in some videos, which results in a strong loss of detail, as can be seen when comparing the iPhone 14 Pro Max with its Samsung peer in the example below.

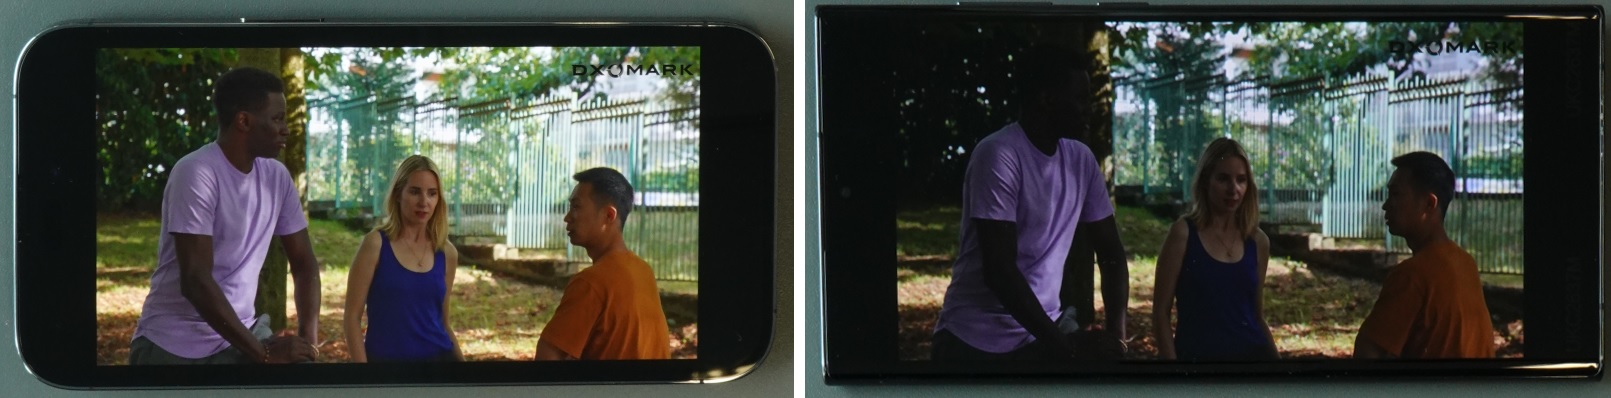
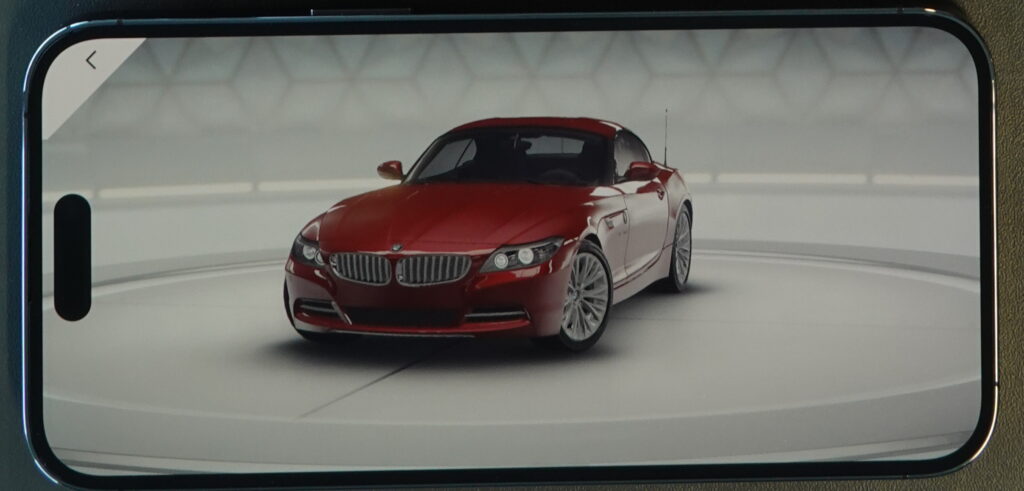
The 14 Pro Max’s increase in brightness ensures a pleasant experience when viewing HDR content indoors, as you can see below. The iPhone measured over 1000 nits on a white HDR10 pattern versus 469 nits for the Samsung.
The iPhone 14 Pro Max is capable of adapting its color gamut depending on the content you play. It matches the DCI-P3 gamut for HDR10 videos and the sRGB gamut for SDR videos well, ensuring pleasant color reproduction when watching videos (although True Tone sets a yellowish white point in a dark environment).


Motion
Apple iPhone 14 Pro Max
155
The motion attribute evaluates the handling of dynamic contents. Frame drops, motion blur, and playback artifacts are scrutinized using games and videos.
The iPhone 14 Pro Max’s control of frame drops is similar to that of the 13 Pro Max’s, with both devices recording only a small number of drops during testing. The new model has better video playback management than its immediate predecessor, and has good reactivity when jumping backwards or forwards.


Touch
Apple iPhone 14 Pro Max
165
To evaluate touch, DXOMARK uses a touch robot and a high-speed camera to play and record a set of scenarios for smoothness, accuracy and response-time evaluation.
The iPhone14 Pro Max’s touch response time is similar to the 13 Pro Max’s, albeit slightly slower, and the 14 Pro Max falls a bit behind the iPhone 13 Pro Max for smoothness when gaming.
Apple iPhone 14 Pro Max 158Artifacts
Evaluating artifacts means checking for the performance, image rendering and motion flaws that can affect the end-user experience. DXOMARK measures precisely the device’s reflectance and the presence of flicker, and assesses the impact of residual aliasing when playing video games, among other characteristics.
The iPhone 14 Pro Max has a reflection rate of 5%, which is similar to the iPhone 13 Pro Max, but is far from the best performance in our database (measured at 4.2%).
Because of its new notch style, the Apple iPhone 14 Pro Max comes with an improved screen-to-body ratio; however, the big notch can be disturbing for some full-screen activities, such as watching movies, and some game apps have not yet adapted their content to the new notch.
The new device continues Apple’s tradition of having excellent control of aliasing.


DXOMARK invites our readership (you) to post comments on the articles on this website. Read more about our Comment Policy.