We put the Xiaomi 13 through our rigorous DXOMARK Camera test suite to measure its performance in photo, video, and zoom quality from an end-user perspective. This article breaks down how the device fared in a variety of tests and several common use cases and is intended to highlight the most important results of our testing with an extract of the captured data.
Overview
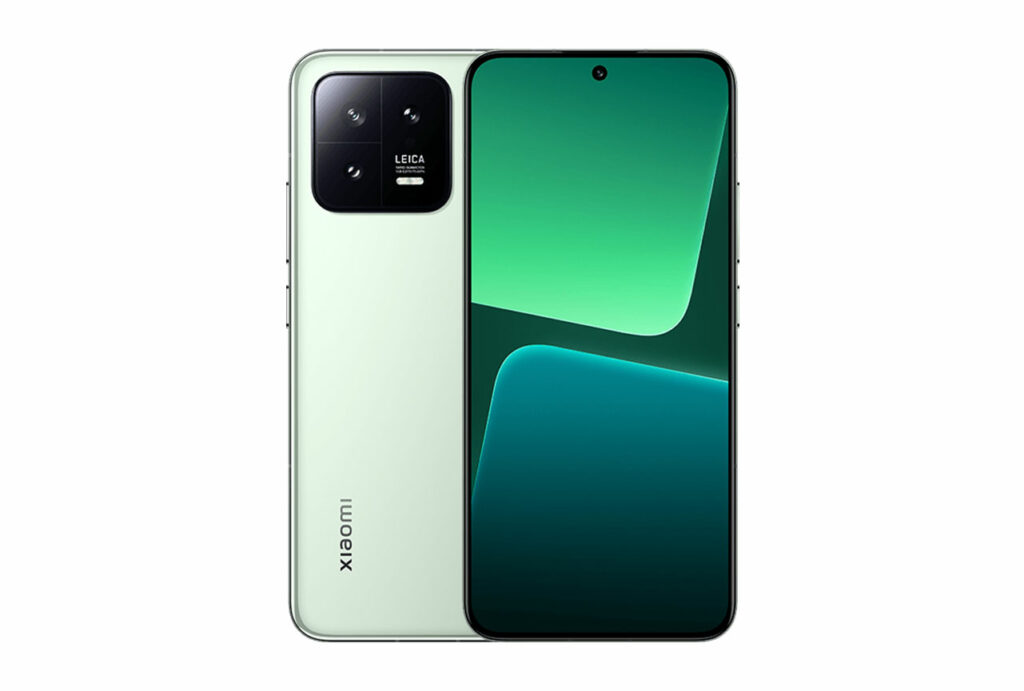
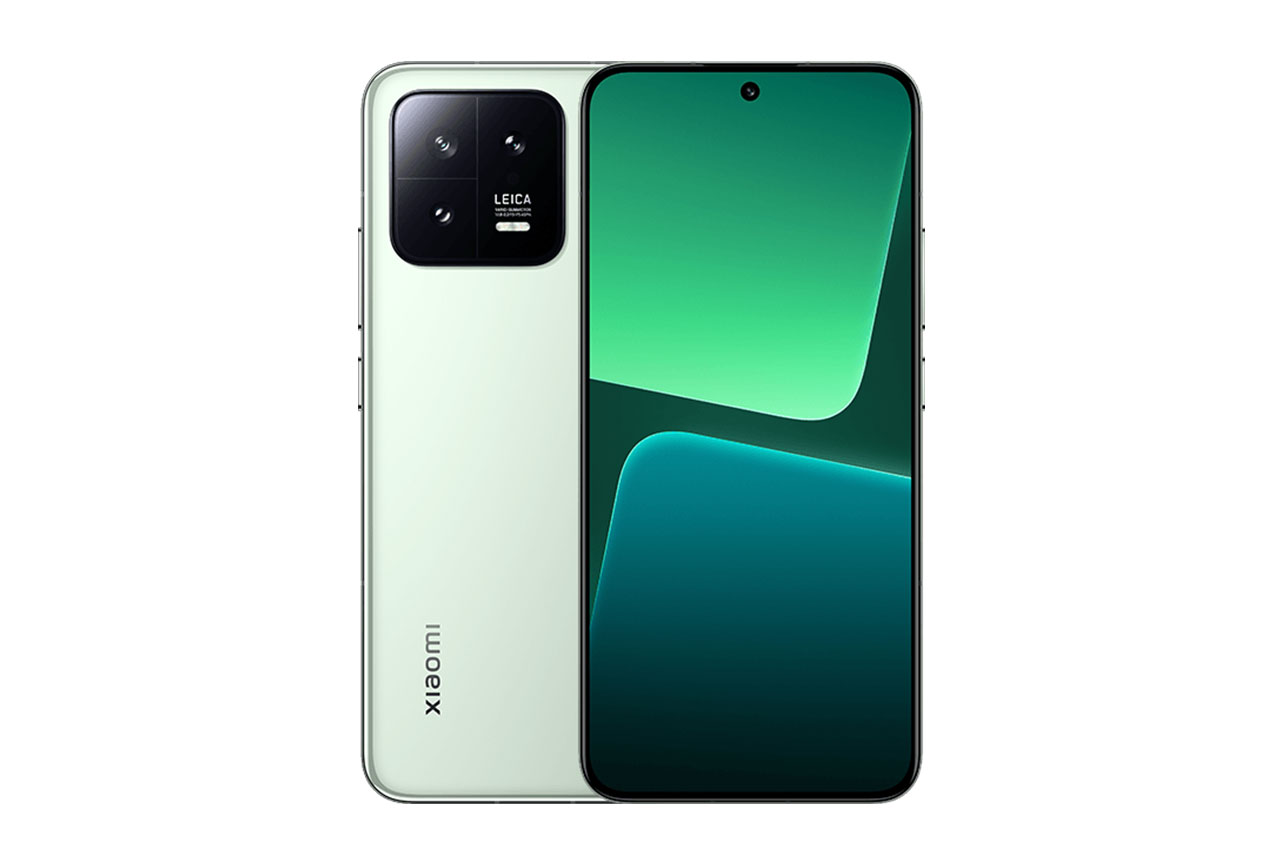
Key camera specifications:
- Primary: 50MP 1/1.49″ sensor, 1.0µm pixels, 23mm equivalent f/1.8- aperture lens, PDAF, OIS
- Ultra-wide: 12MP 1/3.06″ sensor, 1.12µm pixels, 15mm equivalent f/2.2-aperture lens
- Tele: 10MP 1/3.75″ sensor, 1.0µm pixels, 75mm equivalent (3.2x) f/2.0-aperture lens, PDAF, OIS
Scoring
Sub-scores and attributes included in the calculations of the global score.
Xiaomi 13
Use cases & Conditions
Use case scores indicate the product performance in specific situations. They are not included in the overall score calculations.
Outdoor
Photos & videos shot in bright light conditions (≥1000 lux)
Indoor
Photos & videos shot in good lighting conditions (≥100lux)
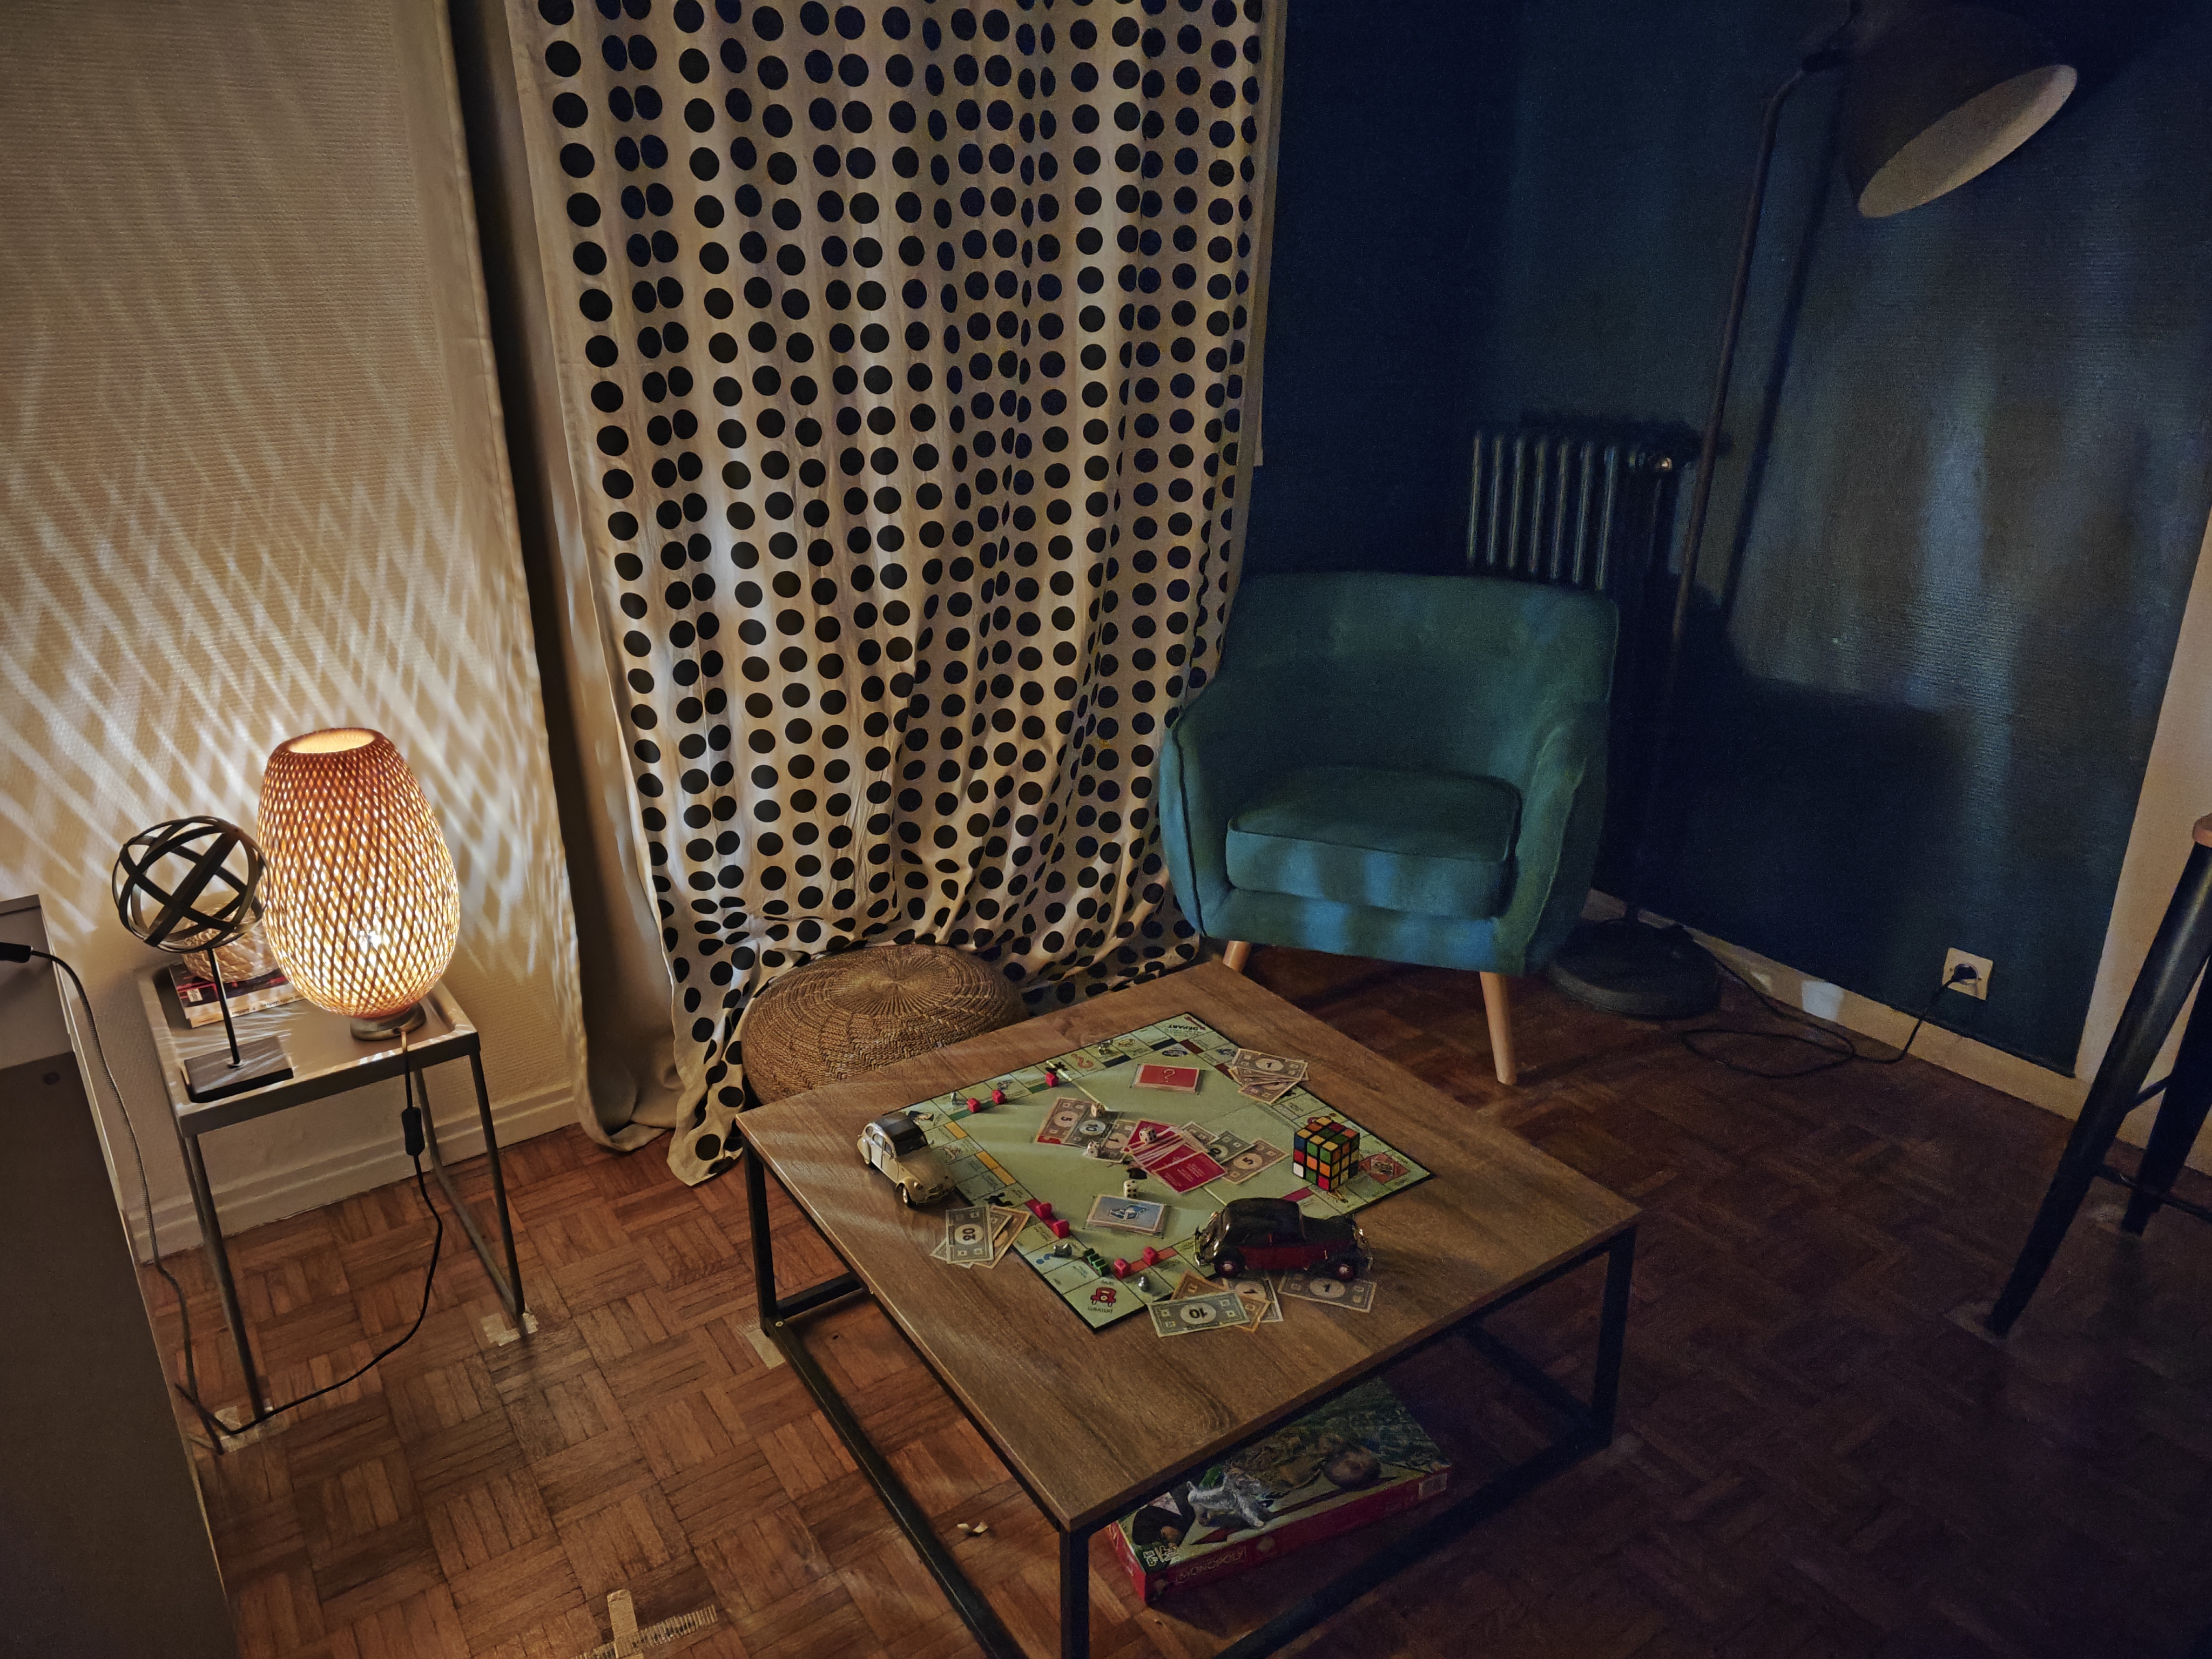
Lowlight
Photos & videos shot in low lighting conditions (<100 lux)
Friends & Family
Portrait and group photo & videos
Pros
- Neutral white balance and nice color for photo, even in difficult conditions
- Good exposure in daylight and indoors for photo and video
- Good texture and detail in most conditions
- Good texture-noise tradeoff in most conditions
- Almost free of unwanted artifacts in video
Cons
- Limited dynamic range indoors and in low light
- Some exposure adaptation instabilities indoors and in low light
- Some video autofocus failures, shallow depth of field
- Imprecise depth estimation in bokeh mode
- Artifacts, such as halos and ghosting, in photos, frame shift in panning videos
With a DXOMARK Camera score of 130, the Xiaomi 13 delivered a good performance, thanks to a triple camera configuration that allows for good quality photo and video capture in pretty much all kinds of conditions. While the device wasn’t near the top of our ranking, the Xiaomi 13 camera still performed well within its price segment.
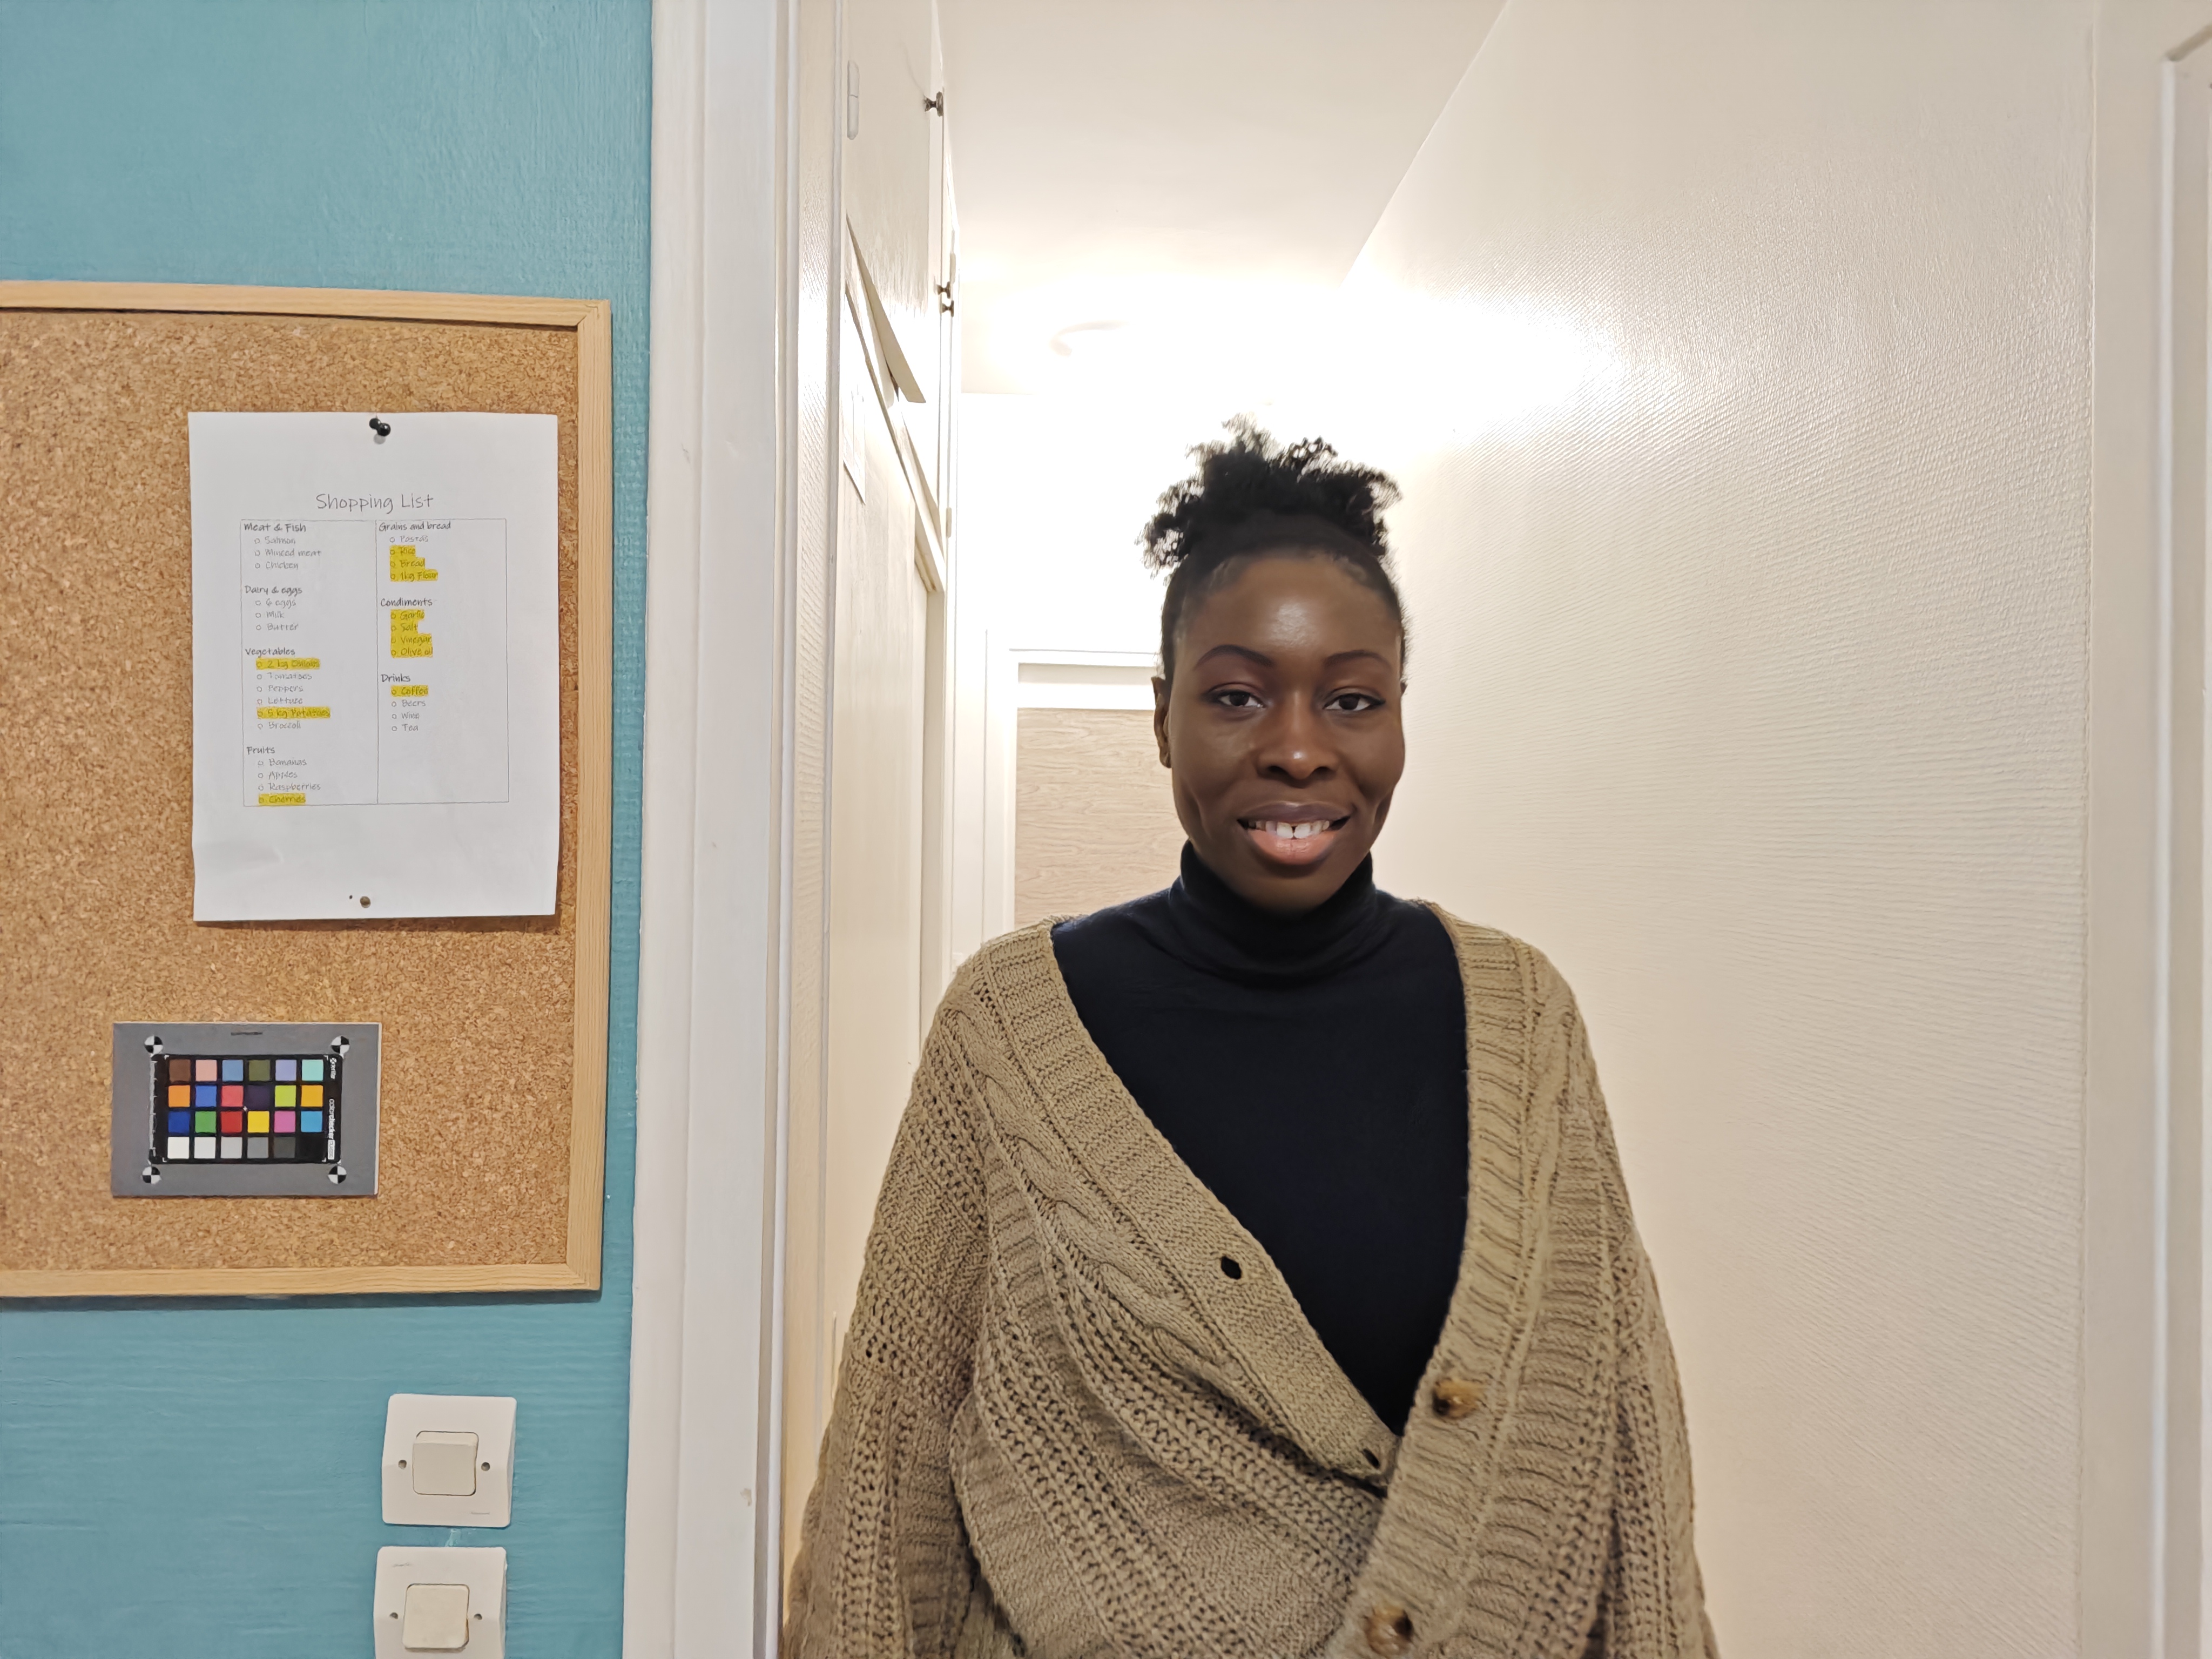
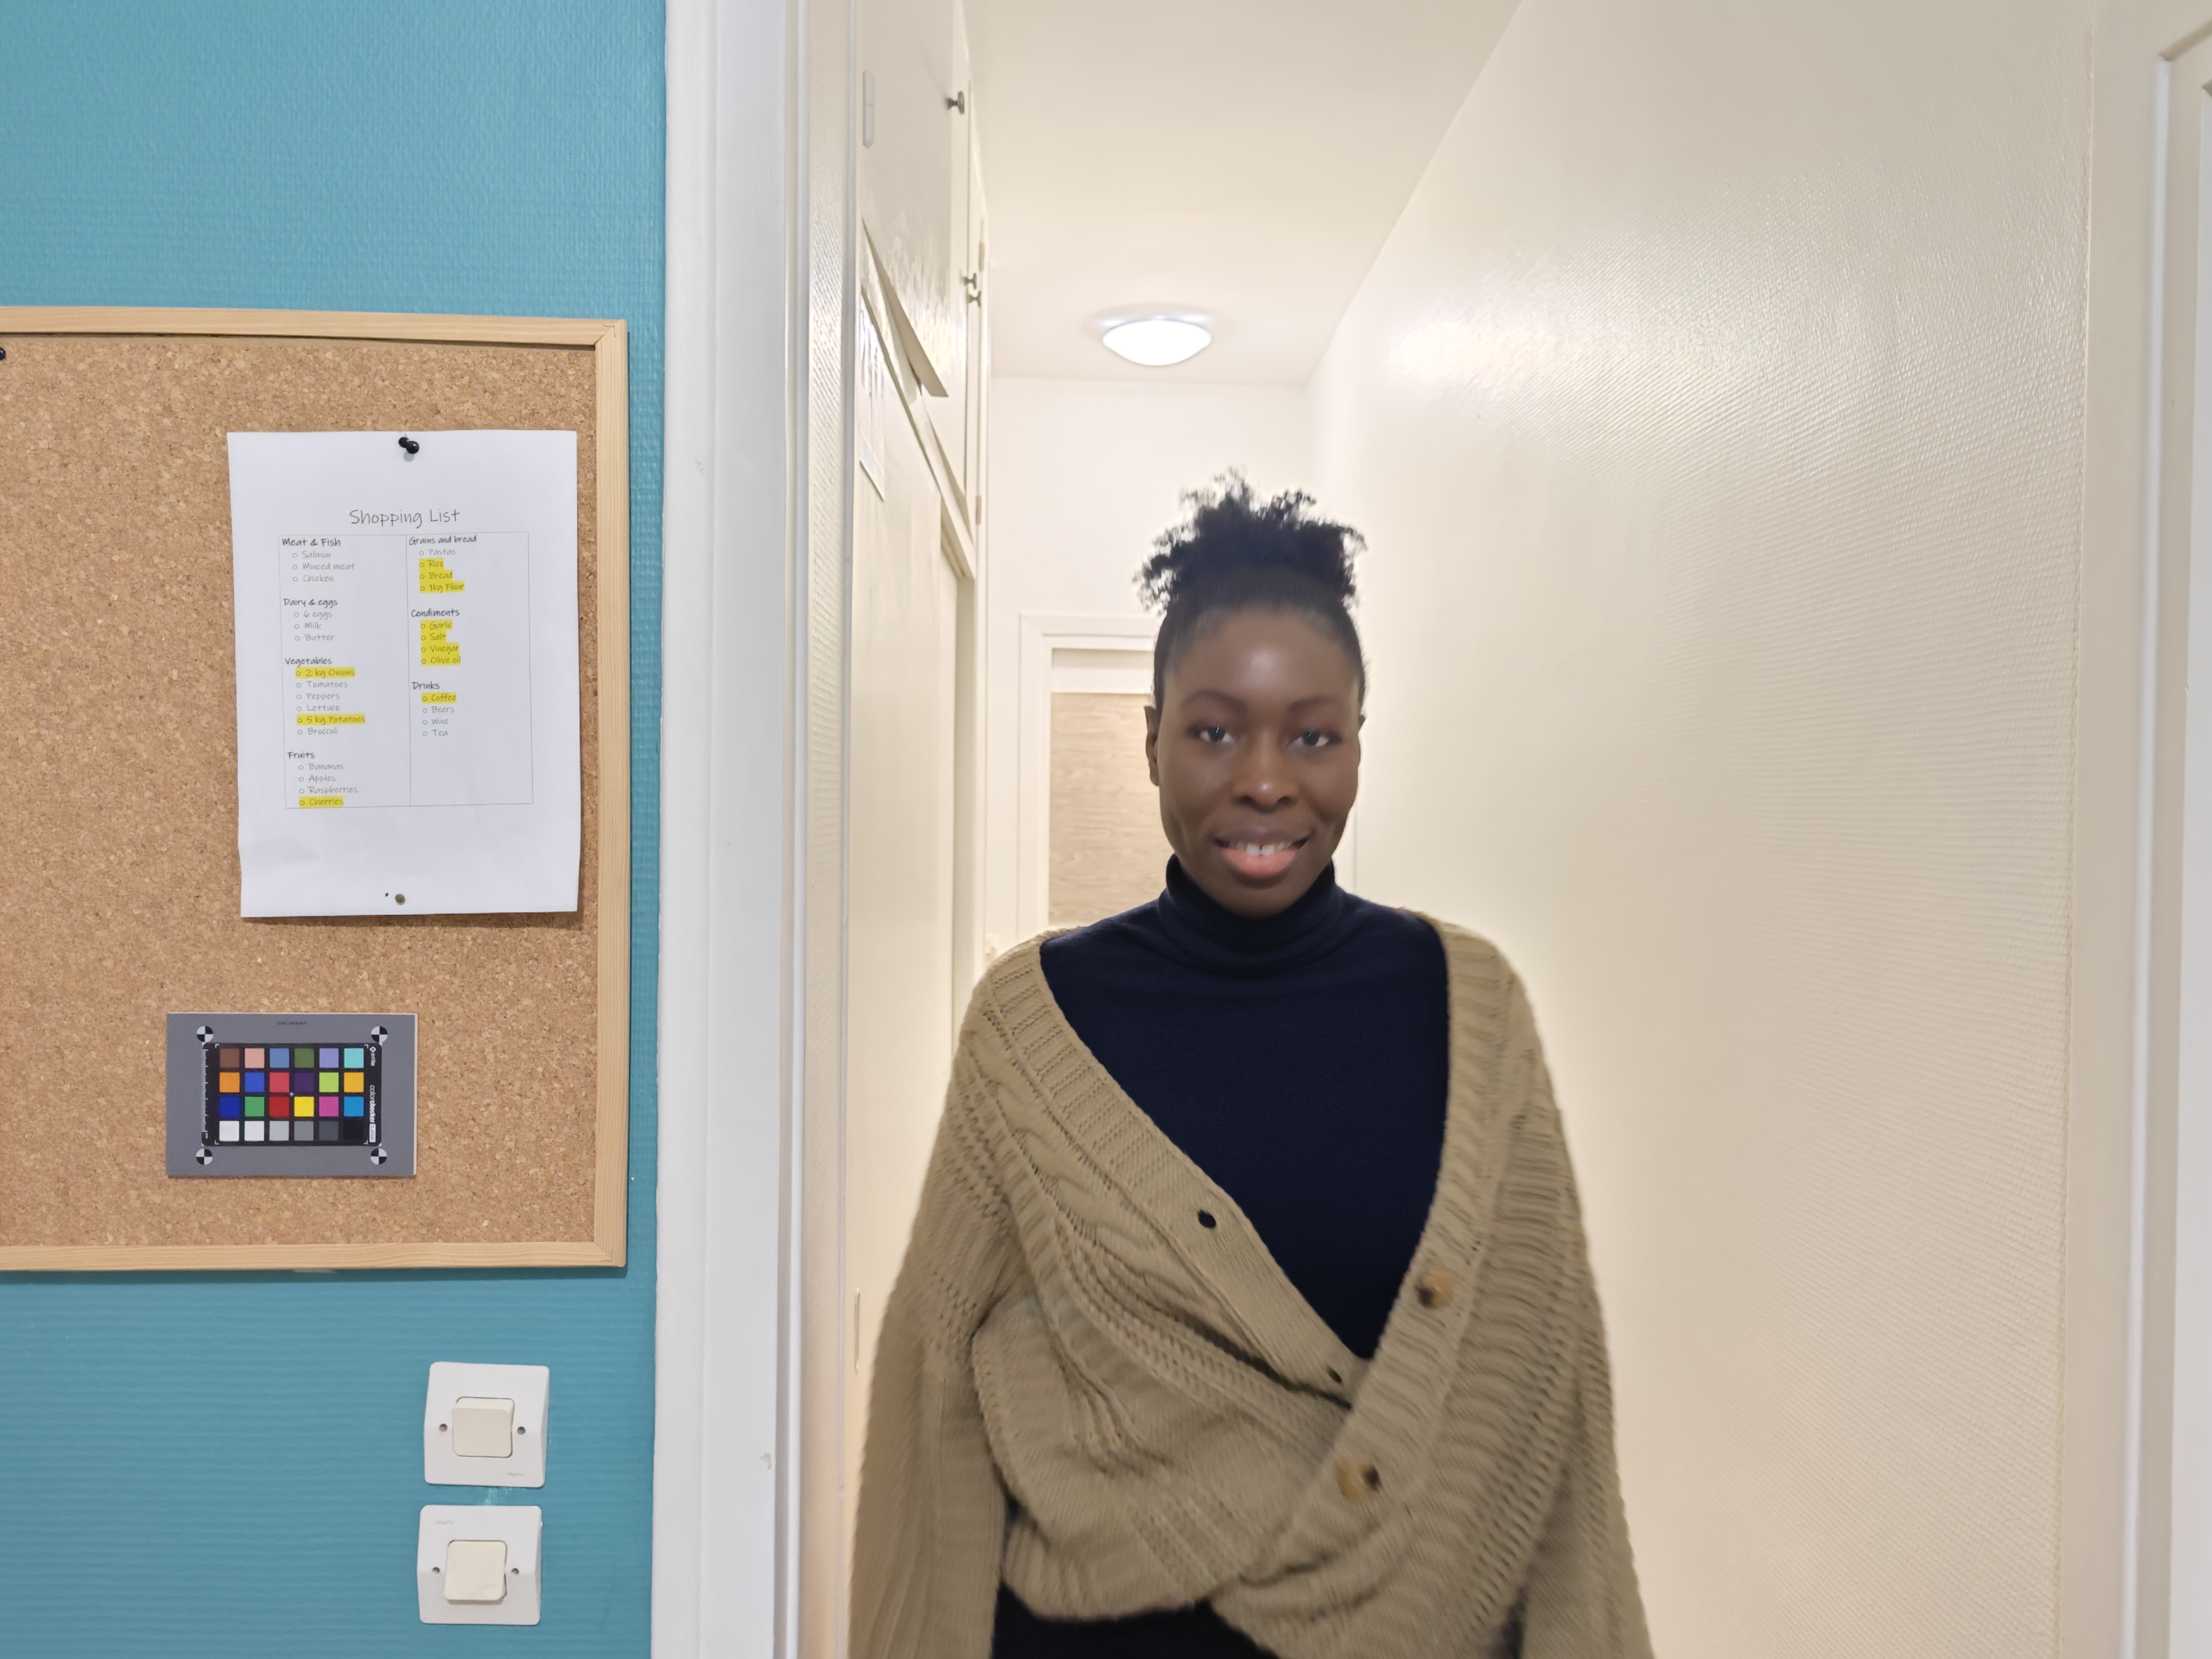
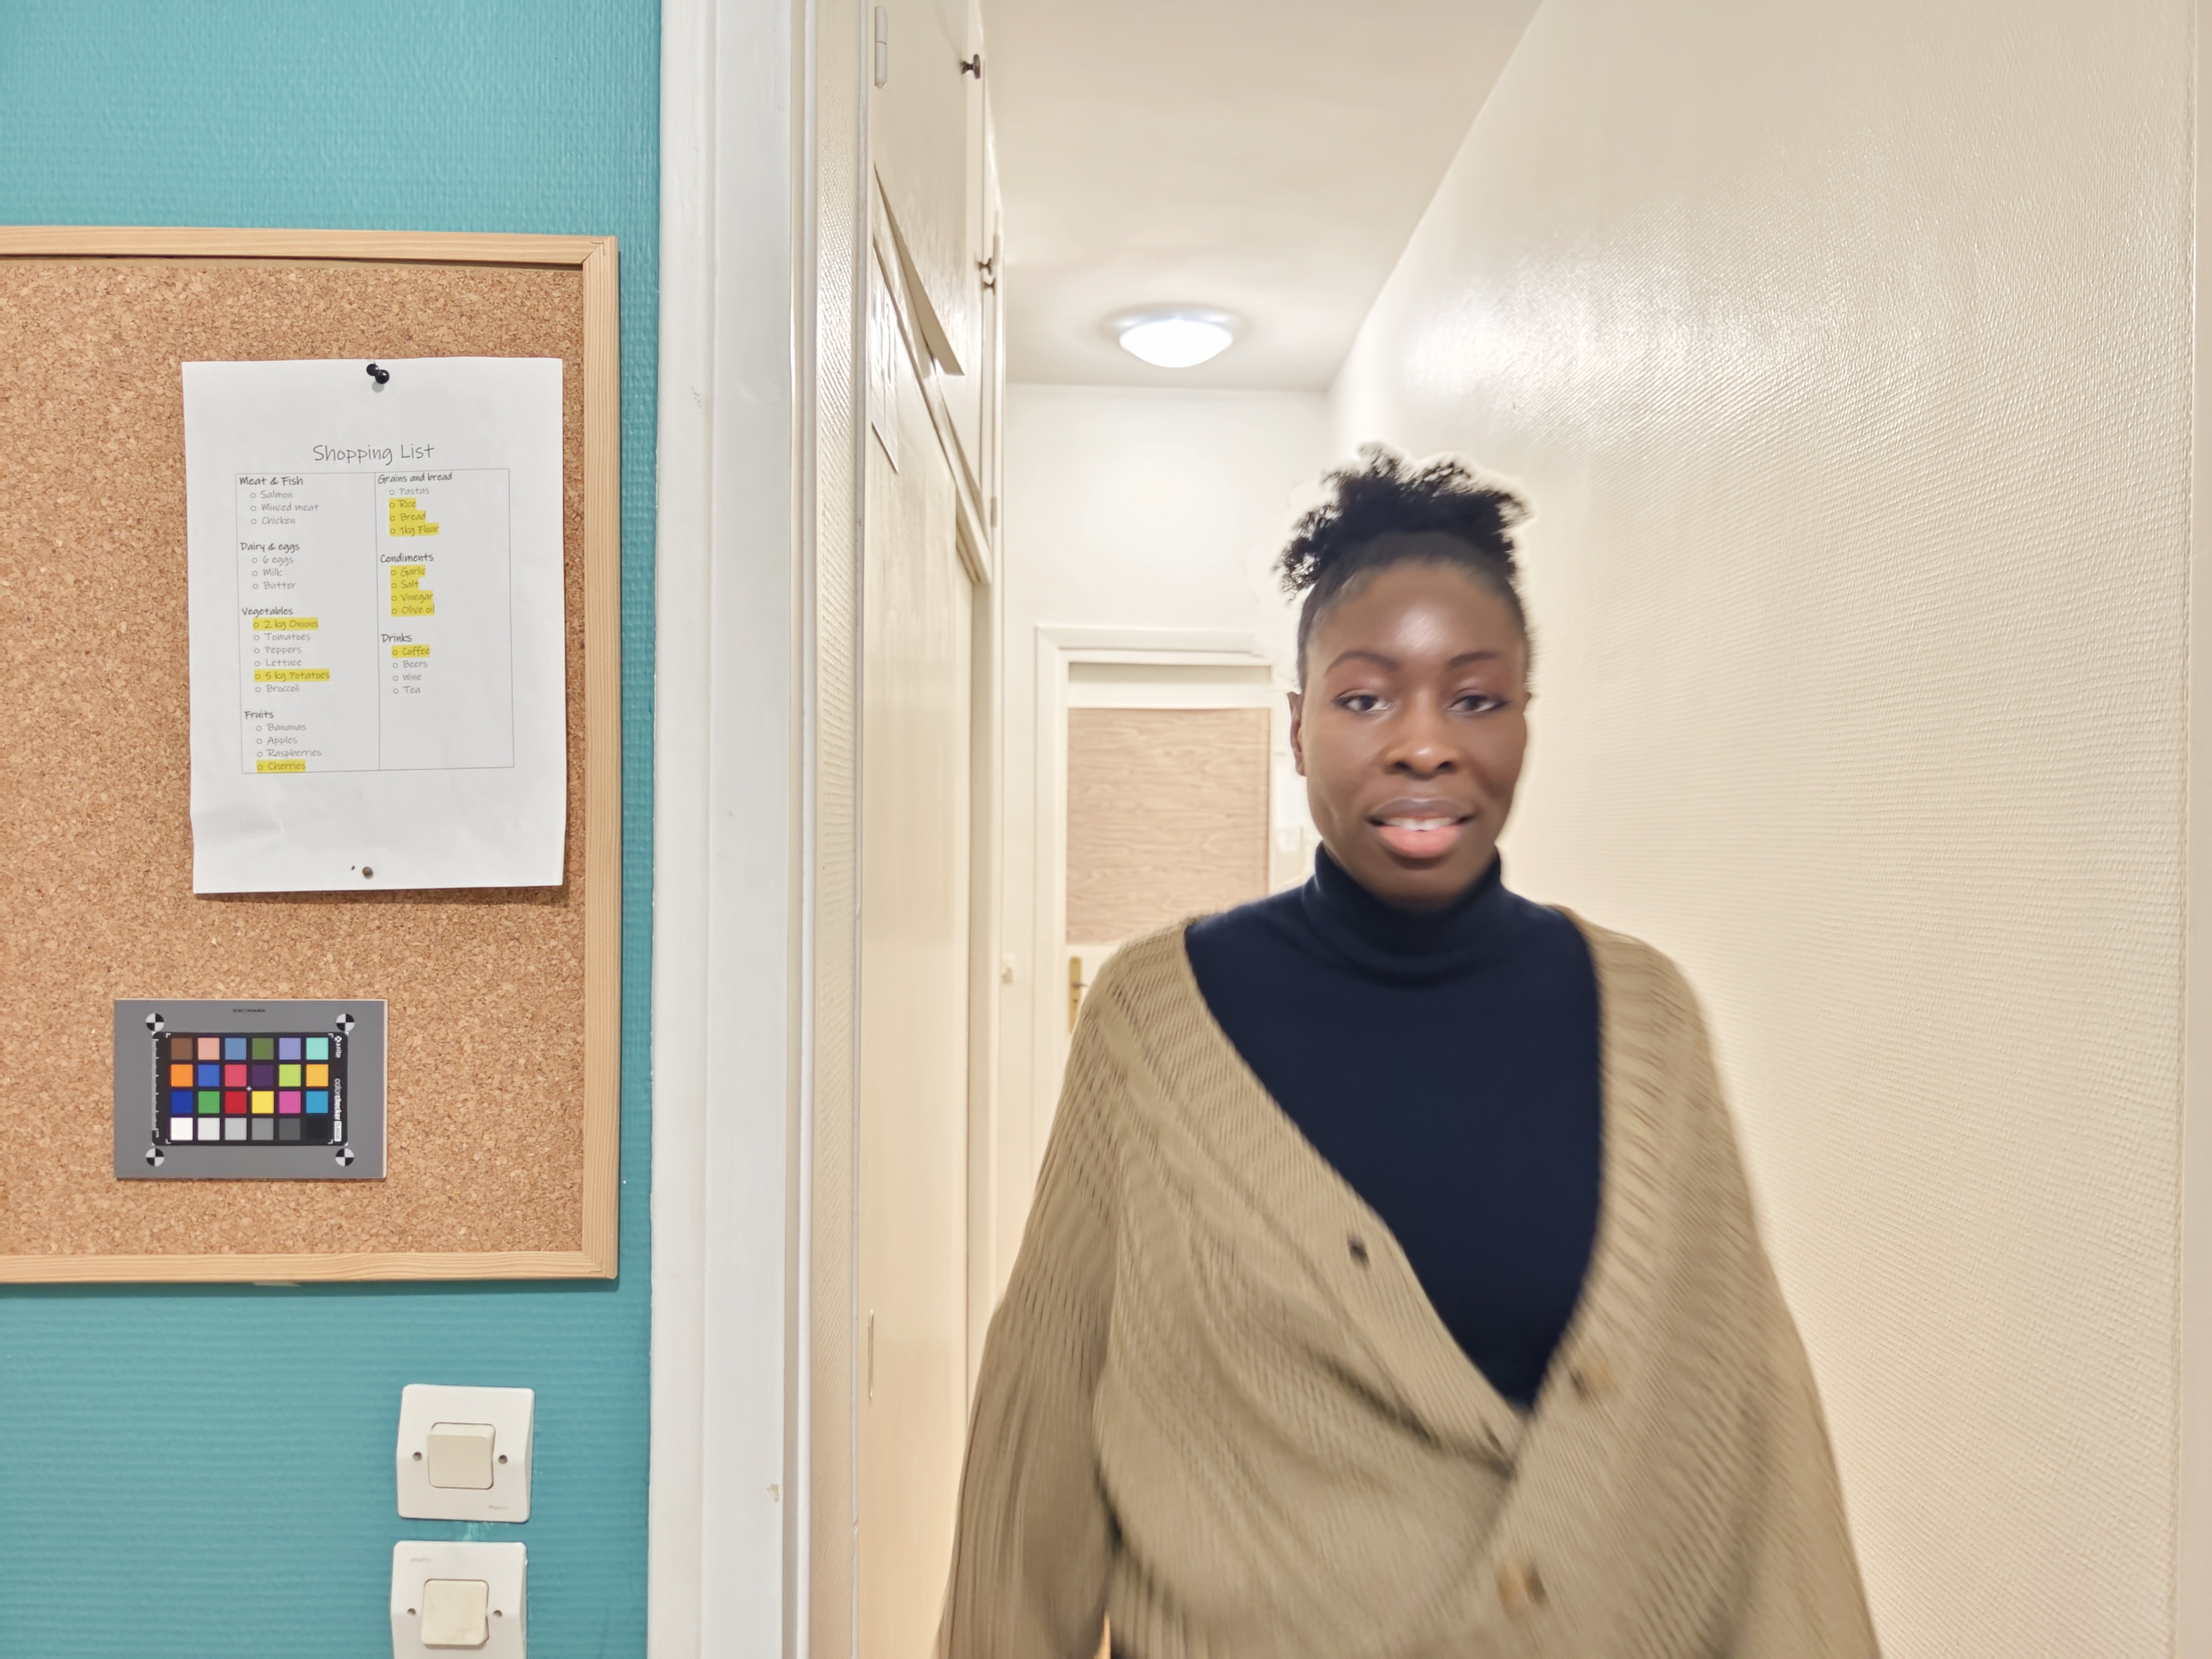
In our testing, the Xiaomi 13’s main strengths in photo mode were its ability to deliver a fairly neutral white balance and nice color across a variety of conditions, including low light. Overall exposure was fairly accurate, but in high-contrast scenes, a lack of dynamic range could result in shadow and/or highlight clipping. The camera also managed to maintain a good tradeoff between image detail and noise reduction, but our testers observed some unwanted artifacts, for example, halo effects and ghosting, especially in scenes where HDR processing kicked in. Autofocus was generally accurate but slow. We also noticed that in group shots the camera did not always focus on the subject closest to the camera.
The Xiaomi 13 did fairly well for both ultra-wide and tele zoom. Zoom images showed good exposure, but compared to the 13 Pro with its more powerful imaging hardware and larger sensors, detail was generally lower and noise levels were higher.
In video mode, our testers found exposure to be accurate and video clips showed good texture rendering in most conditions. In addition, Xiaomi 13 videos were pretty much free of unwanted artifacts. However, we also observed some exposure instabilities, white balance casts, and autofocus instabilities in indoor light conditions and low light. These shortcomings prevented the device from achieving a video score closer to the best in class.
Test summary
About DXOMARK Camera tests: DXOMARK’s Camera evaluations take place in laboratories and in real-world situations using a wide variety of subjects. The scores rely on objective tests for which the results are calculated directly by measurement software on our laboratory setups, and on perceptual tests in which a sophisticated set of metrics allow a panel of image experts to compare aspects of image quality that require human judgment. Testing a smartphone involves a team of engineers and technicians for about a week. Photo, Zoom, and Video quality are scored separately and then combined into an Overall score for comparison among the cameras in different devices. For more information about the DXOMARK Camera protocol, click here. More details on smartphone camera scores are available here. The following section gathers key elements of DXOMARK’s exhaustive tests and analyses. Full performance evaluations are available upon request. Please contact us on how to receive a full report.
Photo
Xiaomi 13
154
For scoring and analysis, DXOMARK engineers capture and evaluate more than 2,600 test images both in controlled lab environments and in outdoor, indoor and low-light natural scenes, using the camera’s default settings. The photo protocol is designed to take into account the main use cases and is based on typical shooting scenarios, such as portraits, family, and landscape photography. The evaluation is performed by visually inspecting images against a reference of natural scenes, and by running objective measurements on images of charts captured in the lab under different lighting conditions from 1 to 1,000+ lux and color temperatures from 2,300K to 6,500K.

Exposure
Xiaomi 13
117

Color
Xiaomi 13
119
Exposure and color are the key attributes for technically good pictures. For exposure, the main attribute evaluated is the brightness of the main subject through various use cases such as landscape, portrait, or still life. Other factors evaluated are the contrast and the dynamic range, eg. the ability to render visible details in both bright and dark areas of the image. Repeatability is also important because it demonstrates the camera's ability to provide the same rendering when shooting several images of the same scene.
For color, the image quality attributes analyzed are skin-tone rendering, white balance, color shading, and repeatability. For color and skin tone rendering, we penalize unnatural colors but we respect a manufacturer's choice of color signature.

Autofocus
Xiaomi 13
116
Autofocus tests concentrate on focus accuracy, focus repeatability, shooting time delay, and depth of field. Shooting delay is the difference between the time the user presses the capture button and the time the image is actually taken. It includes focusing speed and the capability of the device to capture images at the right time, what is called 'zero shutter lag' capability. Even if a shallow depth of field can be pleasant for a single subject portrait or close-up shot, it can also be a problem in some specific conditions such as group portraits; Both situations are tested. Focus accuracy is also evaluated in all the real-life images taken, from infinity to close-up objects and in low light to outdoor conditions.

Texture
Xiaomi 13
114
Texture tests analyze the level of details and the texture of subjects in the images taken in the lab as well as in real-life scenarios. For natural shots, particular attention is paid to the level of details in the bright and dark areas of the image. Objective measurements are performed on chart images taken in various lighting conditions from 1 to 1000 lux and different kinds of dynamic range conditions. The charts used are the proprietary DXOMARK chart (DMC) and the Dead Leaves chart.

Noise
Xiaomi 13
116
Noise tests analyze various attributes of noise such as intensity, chromaticity, grain, structure on real-life images as well as images of charts taken in the lab. For natural images, particular attention is paid to the noise on faces, landscapes, but also on dark areas and high dynamic range conditions. Noise on moving objects is also evaluated on natural images. Objective measurements are performed on images of charts taken in various conditions from 1 to 1000 lux and different kinds of dynamic range conditions. The chart used is the Dead Leaves chart and the standardized measurement such as Visual Noise derived from ISO 15739.

Artifacts
Xiaomi 13
81
The artifacts evaluation looks at lens shading, chromatic aberrations, geometrical distortion, edges ringing, halos, ghosting, quantization, unexpected color hue shifts, among others type of possible unnatural effects on photos. The more severe and the more frequent the artifact, the higher the point deduction on the score. The main artifacts observed and corresponding point loss are listed below.
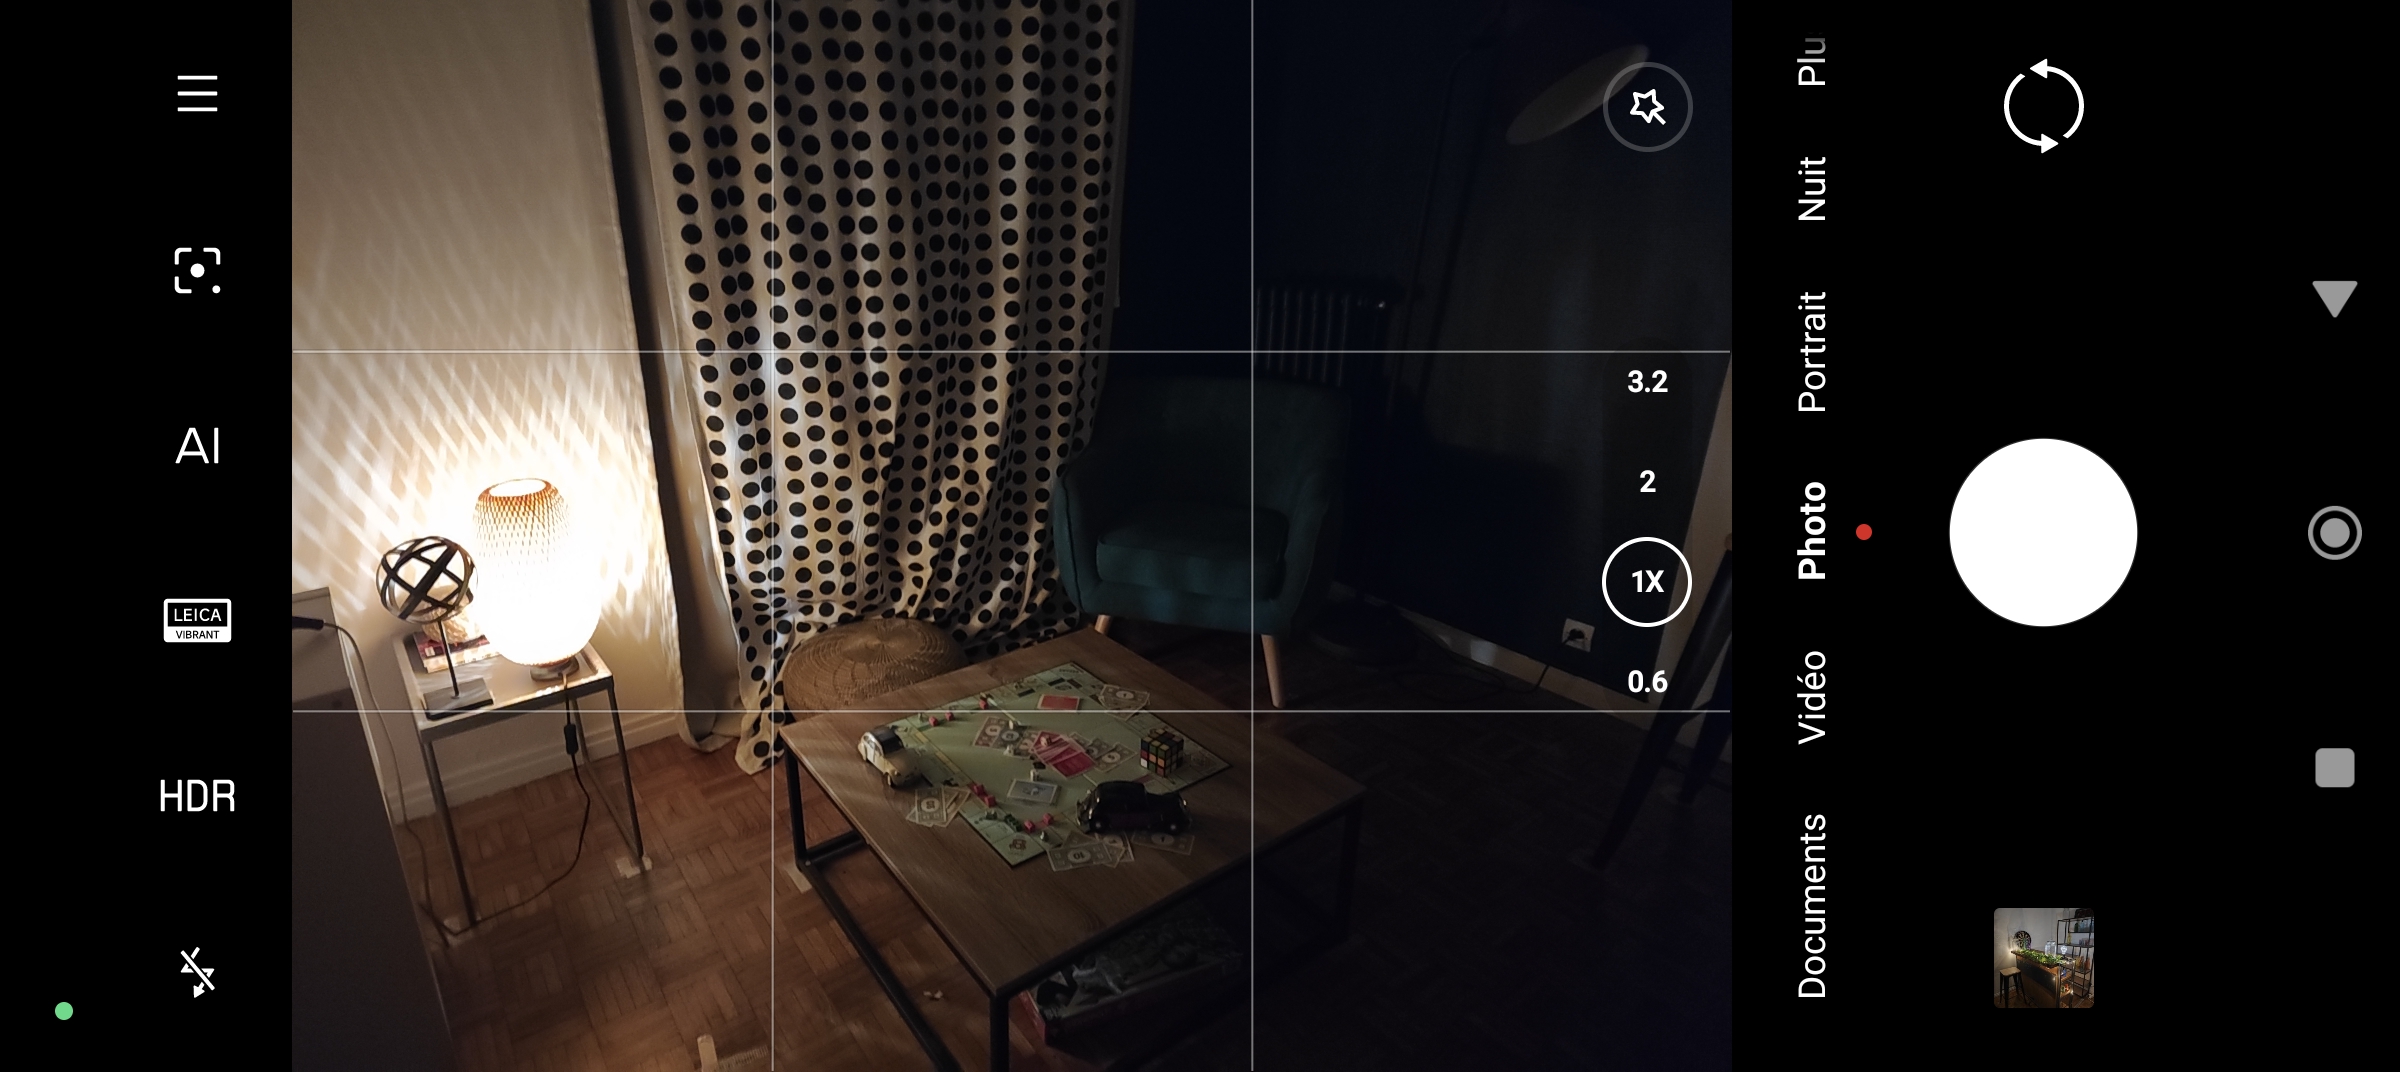
Preview
Xiaomi 13
91
Preview tests analyze the image quality of the camera app's preview of the image, with particular attention paid to the difference between the capture and the preview, especially regarding dynamic range and the application of the bokeh effect. Also evaluated is the smoothness of the exposure, color and focus adaptation when zooming from the minimal to the maximal zoom factor available. The preview frame rate is measured using the LED Universal Timer.
Zoom
Xiaomi 13
156
DXOMARK engineers capture and evaluate over 400 test images in controlled lab environments and in outdoor, indoor, and low-light natural scenes, using the camera’s default settings and pinch zoom at various zoom factors from ultra wide to very long-range zoom. The evaluation is performed by visually inspecting the images against a reference of natural scenes, and by running objective measurements of chart mages captured in the lab under different conditions from 20 to 1000 lux and color temperatures from 2300K to 6500K.

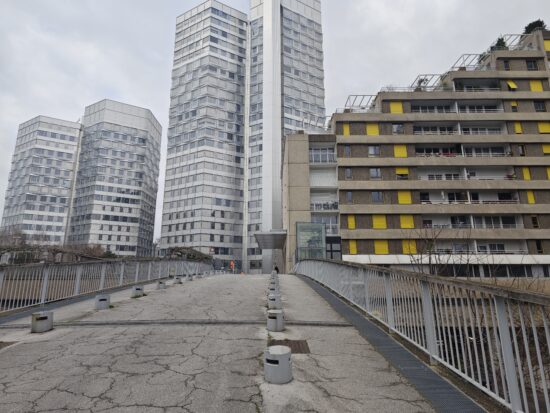
Wide
Xiaomi 13
117
These tests analyze the performance of the ultra-wide camera at several focal lengths from 12 mm to 20 mm. All image quality attributes are evaluated, with particular attention paid to such artifacts as chromatic aberrations, lens softness, and distortion. Pictures below are an extract of tested scenes.


Tele
Xiaomi 13
116
All image quality attributes are evaluated at focal lengths from approximately 40 mm to 300 mm, with particular attention paid to texture and detail. The score is derived from a number of objective measurements in the lab and perceptual analysis of real-life images.
Video
Xiaomi 13
149
DXOMARK engineers capture and evaluate more than 2.5 hours of video in controlled lab environments and in natural low-light, indoor and outdoor scenes, using the camera’s default settings. The evaluation consists of visually inspecting natural videos taken in various conditions and running objective measurements on videos of charts recorded in the lab under different conditions from 1 to 1000+ lux and color temperatures from 2,300K to 6,500K.
Exposure
Xiaomi 13
115
Color
Xiaomi 13
117
Exposure tests evaluate the brightness of the main subject and the dynamic range, eg. the ability to render visible details in both bright and dark areas of the image. Stability and temporal adaption of the exposure are also analyzed.
Image-quality color analysis looks at color rendering, skin-tone rendering, white balance, color shading, stability of the white balance and its adaption when light is changing.
Texture
Xiaomi 13
115
Texture tests analyze the level of details and texture of the real-life videos as well as the videos of charts recorded in the lab. Natural videos recordings are visually evaluated, with particular attention paid to the level of details in the bright and areas as well as in the dark. Objective measurements are performed of images of charts taken in various conditions from 1 to 1000 lux. The charts used are the DXOMARK chart (DMC) and Dead Leaves chart.
Noise
Xiaomi 13
118
Noise tests analyze various attributes of noise such as intensity, chromaticity, grain, structure, temporal aspects on real-life video recording as well as videos of charts taken in the lab. Natural videos are visually evaluated, with particular attention paid to the noise in the dark areas and high dynamic range conditions. Objective measurements are performed on the videos of charts recorded in various conditions from 1 to 1000 lux. The chart used is the DXOMARK visual noise chart.

Stabilization
Xiaomi 13
117
Stabilization evaluation tests the ability of the device to stabilize footage thanks to software or hardware technologies such as OIS, EIS, or any others means. The evaluation looks at residual motion, smoothness, jellow artifacts and residual motion blur on walk and run use cases in various lighting conditions. The video below is an extract from one of the tested scenes.
Artifacts
Xiaomi 13
86
Artifacts are evaluated with MTF and ringing measurements on the SFR chart in the lab as well as frame-rate measurements using the LED Universal Timer. Natural videos are visually evaluated by paying particular attention to artifacts such as aliasing, quantization, blocking, and hue shift, among others. The more severe and the more frequent the artifact, the higher the point deduction from the score. The main artifacts and corresponding point loss are listed below.
DXOMARK invites our readership (you) to post comments on the articles on this website. Read more about our Comment Policy.